Asset managers are selling into strength — a divergence that often precedes major corrections.
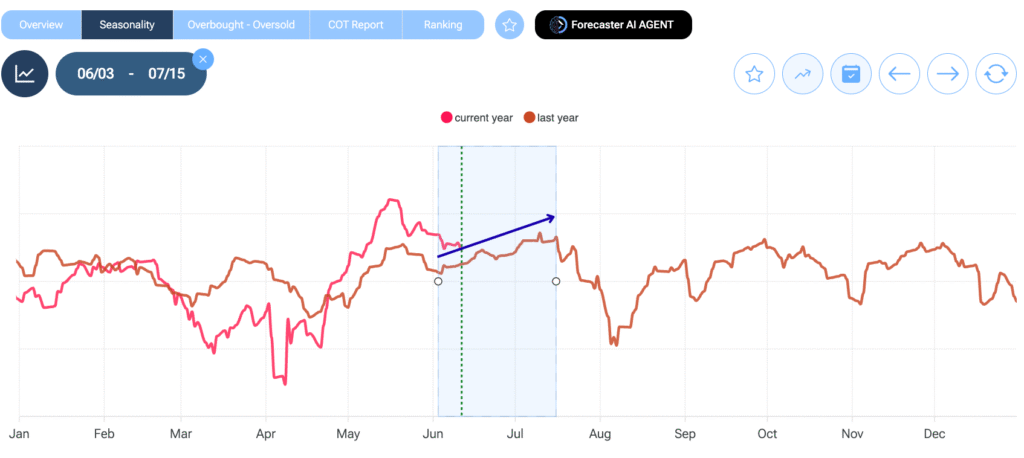
Seasonality signals a market peak in July, followed by a potential 8% drop.
Strategic investors should prepare portfolios by trimming winners and evaluating positions for a potential dip-buying opportunity.
Is the Market Too Good to Be True?
After a breathtaking rally that saw the S&P 500 surge from 5,000 to 6,000 in under a month, investors are understandably euphoric. But behind this bullish price action lies a troubling divergence: According to the Commitment of traders report on the Forecaster Terminal, created using the U.S. Commodity Futures Trading Commission’s Information, the very investors who best anticipate market moves—asset managers—are quietly exiting their positions.
These professionals were net buyers when the S&P was plunging earlier this year, signaling a great entry point. Now, they’re selling into a price rise—often a reliable sign that a top (and potential reversal) may be forming.
A Dangerous Divergence: Price Up, Smart Money Out
If you follow Commitment of Traders (COT) data, you already know that the Asset Manager/Institutional category is key. These participants have a track record of being early and accurate on major market turns.
In April, while the S&P was still falling, they were buying aggressively. That sparked optimism and contributed to the rally we’ve seen since.
But the current situation is reversed:
The S&P 500 is hitting new highs
Asset managers are reducing long exposure
This type of divergence—rising prices with falling smart money interest—often precedes short-term tops or even sharper corrections (as seen in April).
Seasonality Doesn’t Help the Bull Case
When examining the market’s seasonality pattern, a worrisome parallel emerges. The current year is tracking the prior year with over 85% correlation (85% of the current price movements since the start of the year are identical to the 3 years average), If the current price were to continue mimicing the three years average, that historical analog shows:
This echoes a classic market behavior: prices hit all-time highs, make a final “fake breakout,” and then reverse sharply. It’s a textbook bull trap scenario.
Final Thoughts: Prepare, Don’t Panic
Market corrections are natural and necessary. They shake out weak hands and create buying opportunities. The warning signs—insider selling, bearish divergence, and historical seasonality—are aligning.
As always, timing the market is tough. But reading the signs can help us stay cautious when others are greedy. Stay tuned for updates and trade smart.
Start Today
Try Now!
Sign up with Forecaster today and enjoy a free trial of our software!