
What’s Next for the Market? Use Pattern to Spot the Most Likely Scenario
Pattern
What is Pattern?
Pattern is a pattern-matching engine that scans the past for periods when a market behaved “like now” and, from those historical cases, builds the most likely scenarios for the next price moves.
It doesn’t “predict” the future: it estimates probabilities based on measurable similarities between the present and the past.
Adjust Your Portfolio Based on the Economic Cycle -
Statistics Page
When you write “Mom went grocery shopping and bought the …”, a language model often completes it with the most probable word—for example milk—because it has seen many similar sentences.
Projection does the same with prices: it takes the “sentence beginning” (the recent price action), scans history for the most similar sequences, and then completes the sentence with the outcomes that most often followed comparable moves.

In this example, the sentence ‘Mom went grocery shopping and bought the …’ can end in different ways. By looking at past patterns, the model estimates that there is a 90% probability the next word will be milk and only a 10% probability it will be something else. Projection applies the same logic to markets, completing the ‘sentence’ of price action with the most likely scenario.
How Pattern works, briefly
- Identifies the current pattern (highs/lows, range size, event order).
- Finds the best historical matches and ranks them with a similarity score.
- Groups outcomes into two families: BULL and BEAR.
- Displays the average path for both scenarios and their relative probabilities (e.g., “60/40”), leaving risk assessment to the user.
In short: just as ChatGPT completes completes the sentence with “milk”, Projection completes the market’s “text” with the scenario that has historically been most likely among similar contexts.
How to Read the Pattern Output - S&P 500 real life example
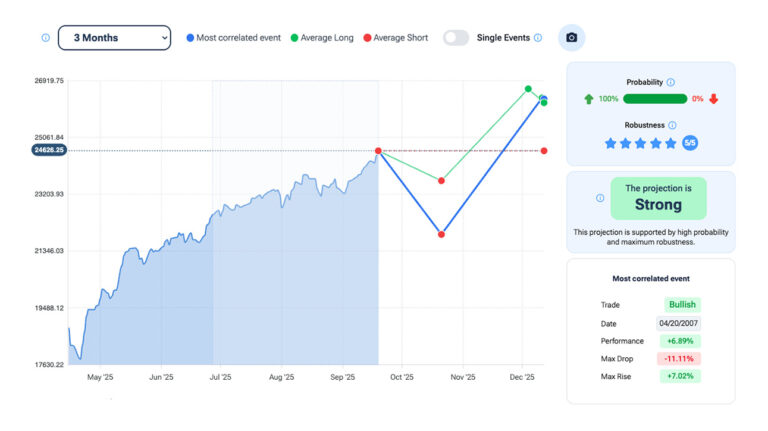
The chart shows the S&P 500’s Patterns over the next three months, based on historical pattern matching.
The system identifies that the most correlated past event occurred between August and October 2006, a period classified as bullish, with a performance of +3.68%, a maximum drawdown of -1.19%, and a maximum rise of +4.20%.
Looking ahead, the projection outlines two possible scenarios: a bullish path (green) and a bearish path (red).
The model currently assigns an 86% probability to the bullish scenario and a 14% probability to the bearish one. Importantly, the robustness of this projection is rated the maximum score (5/5 stars), indicating high confidence in the pattern similarity.
Supporting this outlook, the table below lists additional correlated events, most of which were bullish cases — such as late 2013 (+4.95% performance) and late 1997 (+10.25% performance) — with only one bearish case, from mid-2012.
The system therefore classifies this projection as Strong, highlighting that, based on historical precedents, the S&P 500 is statistically more likely to follow a bullish trajectory in the coming quarter.

Projection compares today’s market patterns with similar cases from the past and visualizes the most likely future scenarios. It shows probabilities for bullish and bearish outcomes, highlights the most correlated historical events, and provides robustness scores to help users assess the strength of each projection.
How to find the best opportunities with Pattern
The Quantum Screener allows users to scan the entire market and identify the instruments with the strongest pattern signals.
Traders can choose among different asset classes, from equities to indices, currencies, or commodities, and select a preferred time horizon, either 1 month or 3 months, depending on their strategy.
The screener also provides the flexibility to analyze both long and short opportunities, ranking results by probability, robustness, and expected return.
This makes it easy to focus on the setups with the highest statistical reliability and to compare opportunities across different markets in just a few clicks.

The Quantum Screener ranks instruments across different asset classes by probability, direction, robustness, and expected return, helping traders quickly spot the strongest opportunities over 1- or 3-month horizons, both long and short.


Start Today
Try the Forecaster Terminal’s Projections Now!
Sign up with Forecaster today and enjoy a free trial of our software!