
S&P 500 Bottom: Data-Driven Analysis & Future Predictions
Key Points:
- The S&P 500 has experienced an 8% drop, but historical seasonality suggests a possible turnaround.
- Fundamental analysis reveals that the index is currently undervalued, potentially signaling a buying opportunity.
- Institutional investors and hedge funds are increasing long positions, indicating confidence in a market recovery.
Understanding the Current S&P 500 Drop
The financial markets have recently witnessed an 8% decline in the S&P 500, raising concerns among investors about whether this downward movement will persist. However, analyzing past market behavior can provide valuable insights into what to expect next. Using a combination of seasonality trends, fundamental analysis, and institutional positioning, we can determine if this is just a temporary correction or the beginning of a prolonged bear market.
Seasonality: A Historical Perspective
One of the most important tools in market analysis is seasonality. By studying the five, seven, and ten-year seasonality patterns, we observe that similar price movements have occurred in the past. The current decline aligns with historical trends, where markets often face a pullback around this time of the year (mid-March) before rebounding.
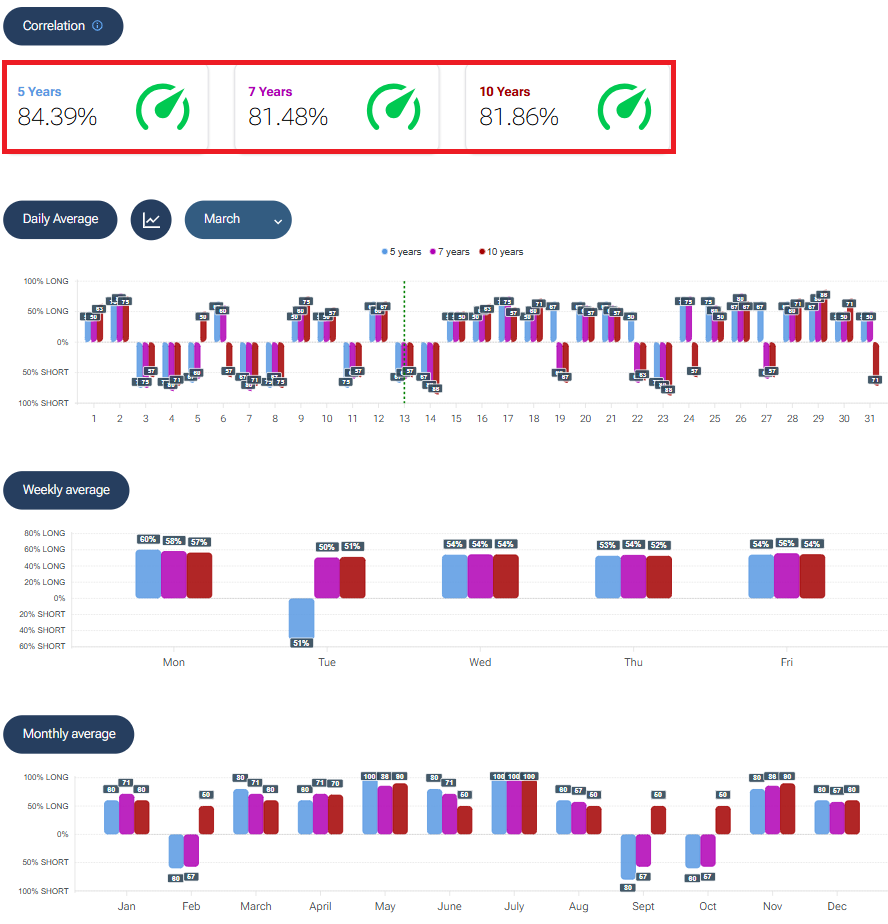
The correlation between current price movements and historical seasonality remains high, exceeding 80%. This suggests that while the recent drop may appear significant in the short term, it is relatively minor when compared to the overall bullish trend of the last two years. Furthermore, historical data indicates that when markets drop during this period, they tend to recover strongly in the months that follow.
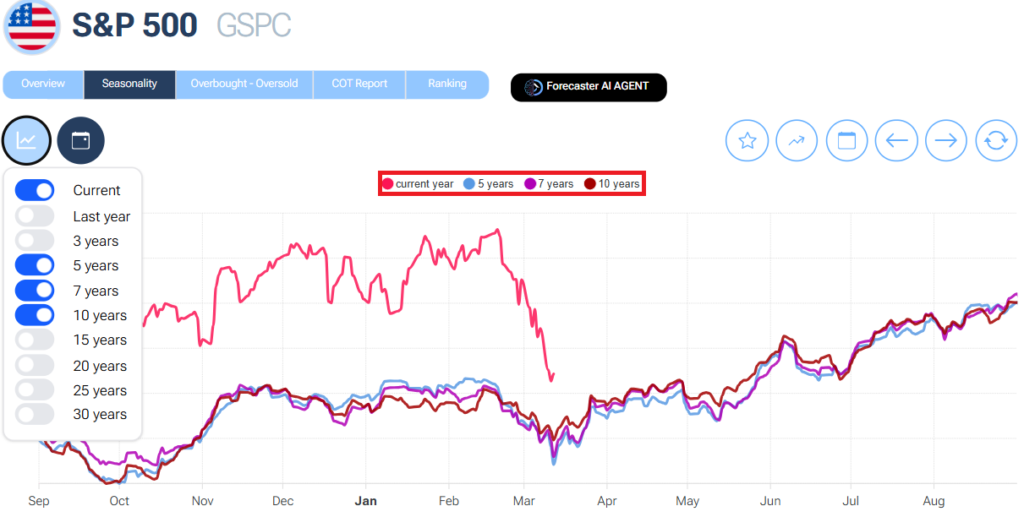
The correlation between current price movements and historical seasonality remains high, exceeding 80%. This suggests that while the recent drop may appear significant in the short term, it is relatively minor when compared to the overall bullish trend of the last two years. Furthermore, historical data indicates that when markets drop during this period, they tend to recover strongly in the months that follow.
Fundamental Analysis: The Fair Value of the S&P 500
Assessing the fundamental value of the index is crucial in determining whether the market is overpriced or undervalued. By using three valuation methods—Discounted Cash Flow (DCF), Peter Lynch’s Fair Value Model, and Economic Value Added (EVA) for each company present on the index —we can estimate the fair value of the S&P 500.
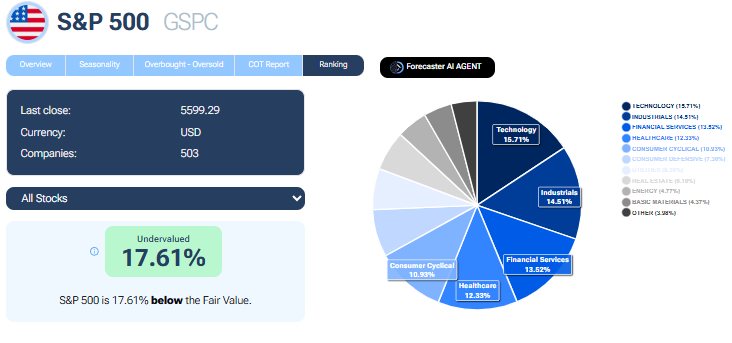
Currently, the index is undervalued by 17% (as of March 13th 2025), a level not seen since 2022. This means that, despite the recent decline, the broader market remains in a strong position, with solid earnings and positive economic indicators. Historically, undervaluation of this magnitude has often led to strong buying interest from institutional investors, eventually driving prices higher.
Institutional Investors Are Buying the Dip
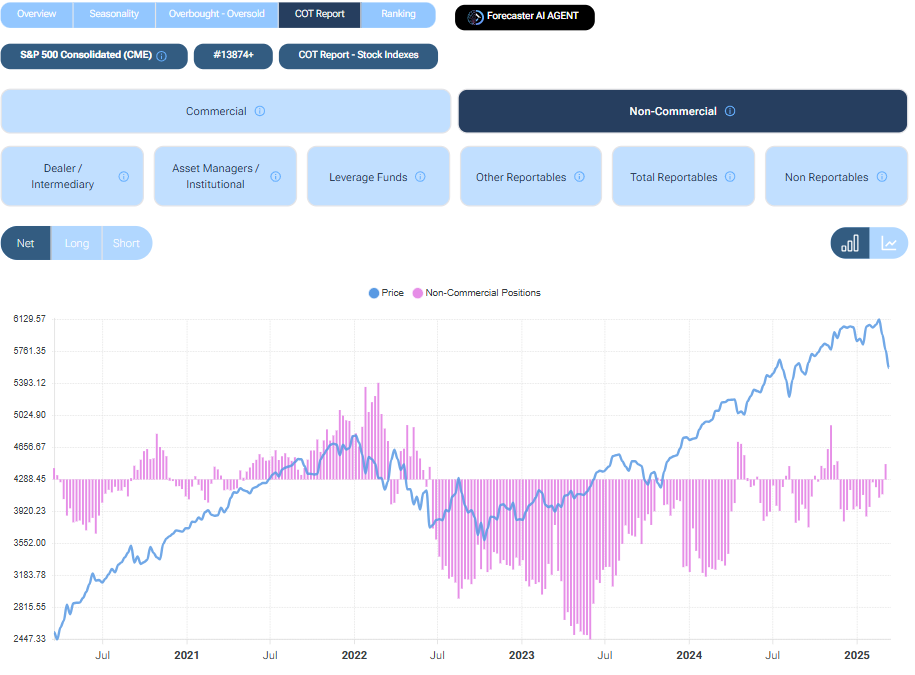
One of the most reliable indicators of market sentiment is the Commitments of Traders (COT) report, which tracks the positioning of large institutional investors and hedge funds. Analysis of the latest COT report reveals a significant increase in long positions among non-commercial traders, indicating confidence in a market recovery.
Whenever institutions increase their long positions during market dips, it historically precedes a reversal in price direction. These investors recognize the market’s undervaluation and seize the opportunity to accumulate positions at lower prices. Their actions signal that, despite short-term volatility, the long-term outlook remains positive.
Technical Indicators: Are We at a Turning Point?
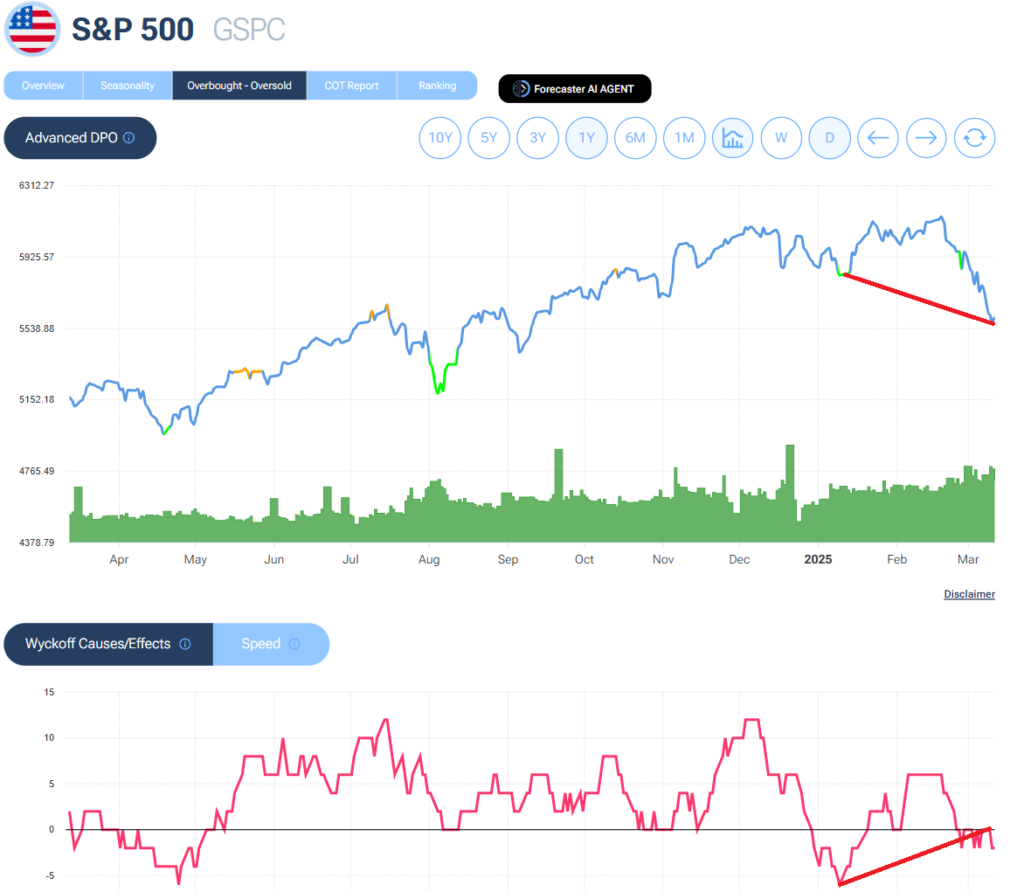
Beyond fundamentals and institutional positioning, technical indicators also provide valuable insights. One such indicator, the Wyckoff, shows a divergence between price action and buyer activity. While the market has recently dropped, the number of buyers has increased—typically a bullish signal indicating a potential reversal.
Moreover, the speed of the market’s decline is another crucial factor. When price movements accelerate downward without signs of slowing, it suggests the potential for further declines. However, once this downward momentum slows, a reversal becomes more likely. By analyzing these technical indicators, we can estimate that the market may experience an additional 2-3% drop before stabilizing and potentially rebounding.
Conclusion: A Potential Buying Opportunity?
Despite the recent market drop, multiple factors indicate that the S&P 500 may be approaching a turning point. Historical seasonality aligns with the current correction, fundamental analysis shows strong undervaluation, and institutional investors are increasing long positions—signs that a market recovery could be near.
While short-term volatility remains a possibility, long-term investors may find this to be a favorable entry point. As always, market conditions should be monitored closely, but the data suggests that the end of this bearish trend could be within sight. Following the seasonality trend in the last ten years we can expect the S&P 500 to reach more or less 5,500 USD before rebounding.