WHY I SOLD NVIDIA STOCK
📌 Key points:
- Dual Strategy: The sale was a tactical decision, closing only the short-term trading position to lock in an 81% profit. The “core” long-term investment remains untouched, awaiting a $10 trillion valuation.
- Fundamental “Ceiling” Reached: The Forecaster‘s fundamental analysis indicated that Nvidia’s stock was no longer undervalued, trading within its “fair value” range ($212-$218), suggesting limited further upside based on fundamentals alone.
- Confluence of Warning Signs: The Forecaster platform flagged multiple technical warnings: a bearish divergence (price rising while momentum fell), the start of a historically weak seasonal period (70% decline rate), and price projections showing minimal upside.
This article outlines the analysis behind a recent operational decision: the sale of a trading position in Nvidia (NVDA). This move requires clear context, as it does not represent a full exit but rather a tactical management of risk and profit on a specific portfolio. The decision was driven by a confluence of data signals provided by the Forecaster software.
The segmented strategy: core vs. tactical
It is crucial to understand the dual-pronged approach governing the Nvidia holdings:
The strategic “Core” holding: This represents the largest, long-term investment, famously acquired using the proceeds from real estate sales. This position remains untouched, as its objective is tied to a multi-year thesis targeting a $10 trillion market capitalization.
The “Tactical” trading position: This was a separate, smaller position managed in a different brokerage account (Fineco), designed for more active, short-term speculation. This is the only position that was closed.
The recent sale was, therefore, an operation isolated to the trading portfolio.
The trigger: when velocity becomes a risk
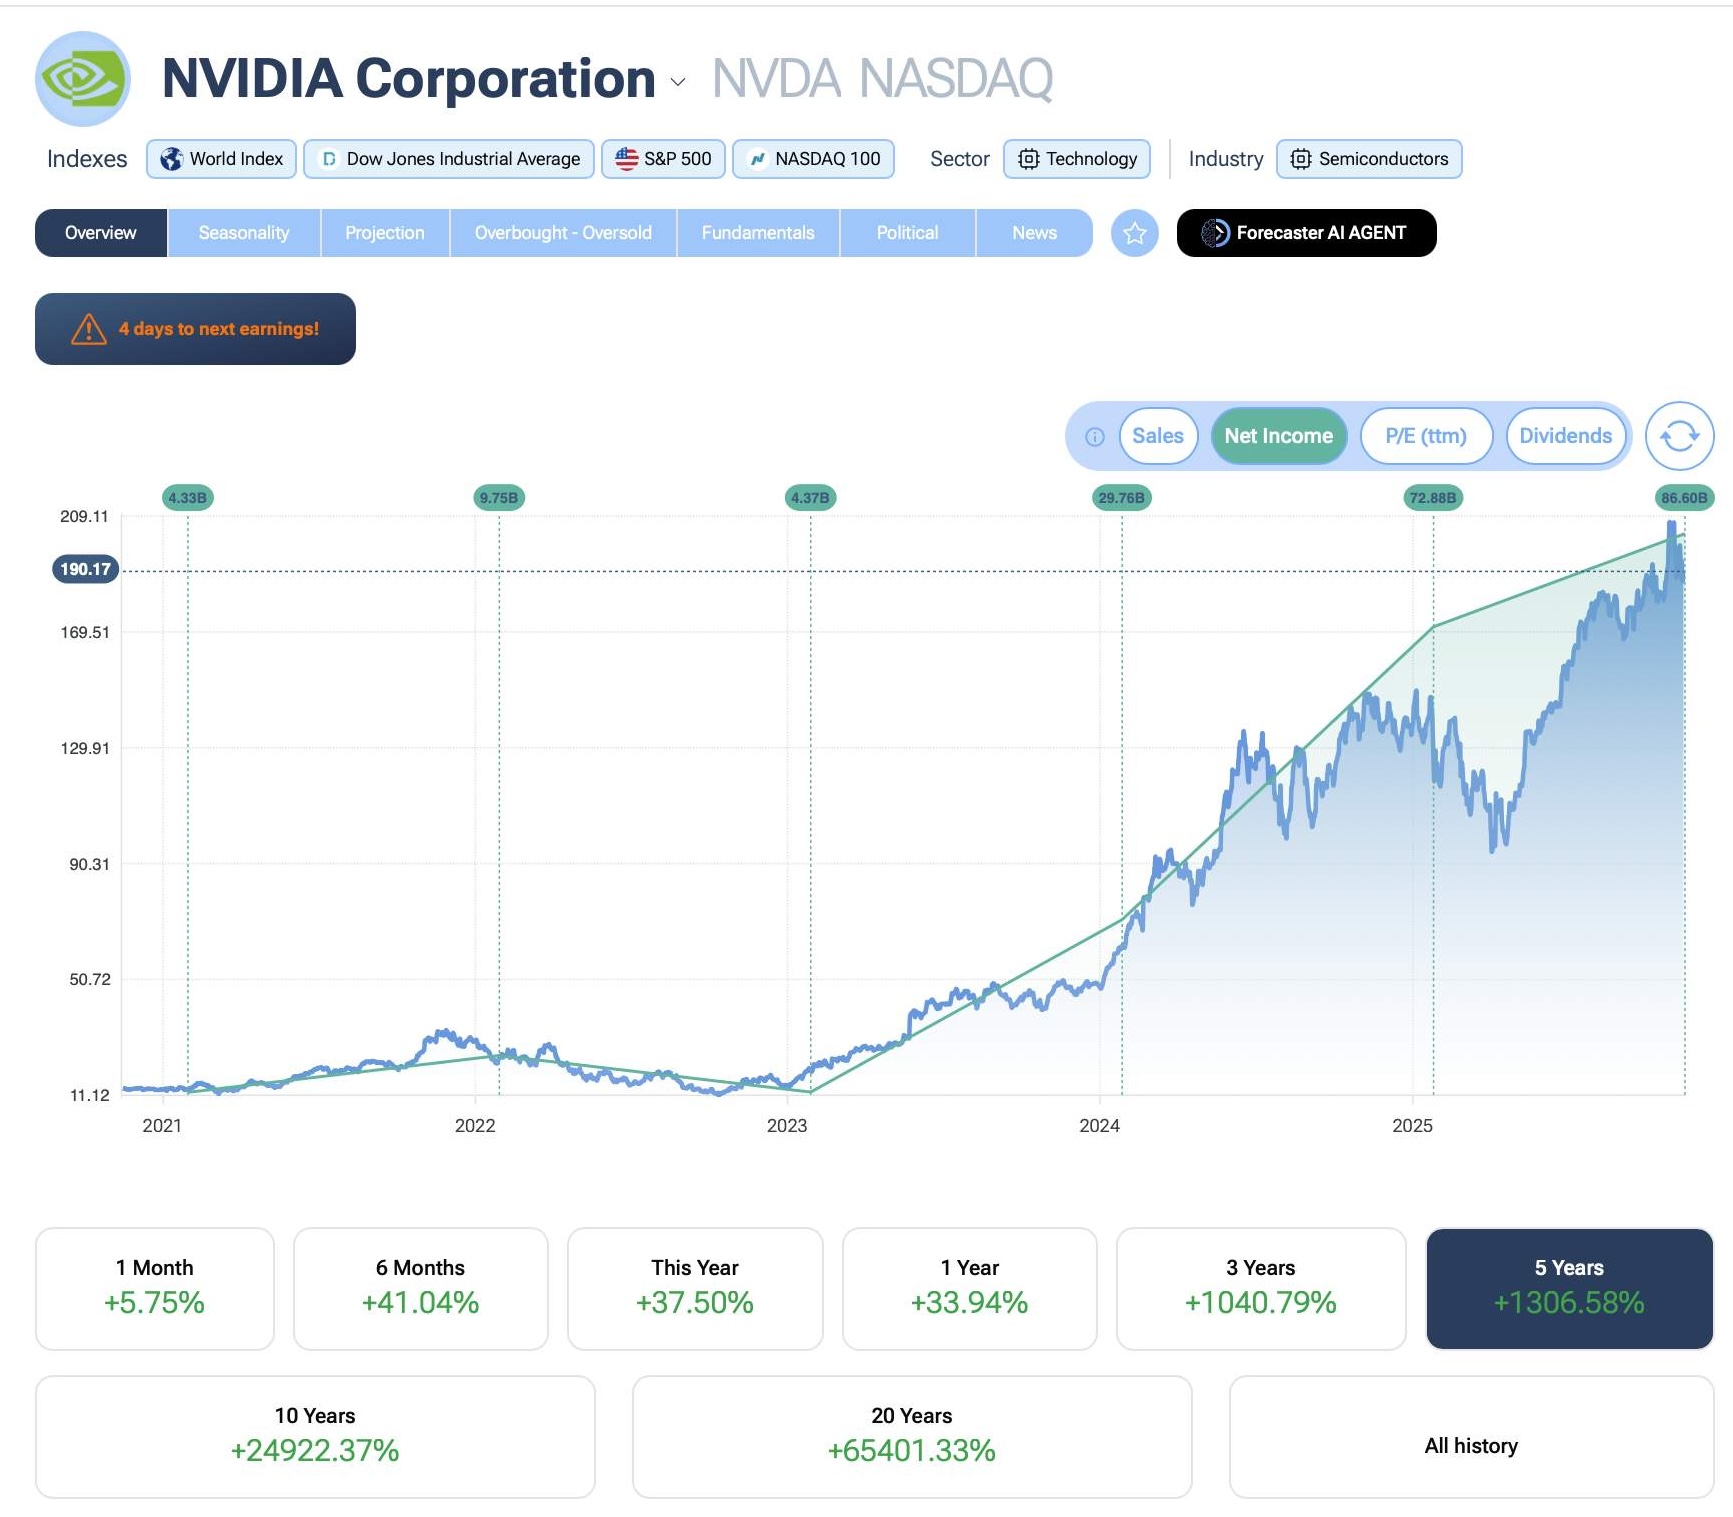
The primary catalyst for the re-evaluation was the stock’s parabolic ascent. The speed of the market’s re-pricing of Nvidia has become a significant factor. Having just recently cleared a $3 trillion valuation, the company rapidly surpassed the $5 trillion mark.
This 81% gain in just six months has driven a notable market distortion, with the S&P 500’s performance increasingly dependent on a handful of stocks. The valuation gap between Nvidia and the second-largest component, Apple, has widened to nearly $1 trillion—a sign of extreme concentration. When a stock’s rise is this vertical, managing the resulting risk becomes paramount.
The Forecaster’s data: a dashboard of warnings
The decision to sell was not based on guesswork but on a sober reading of the data provided by the Forecaster software.
1. The fundamental “ceiling”
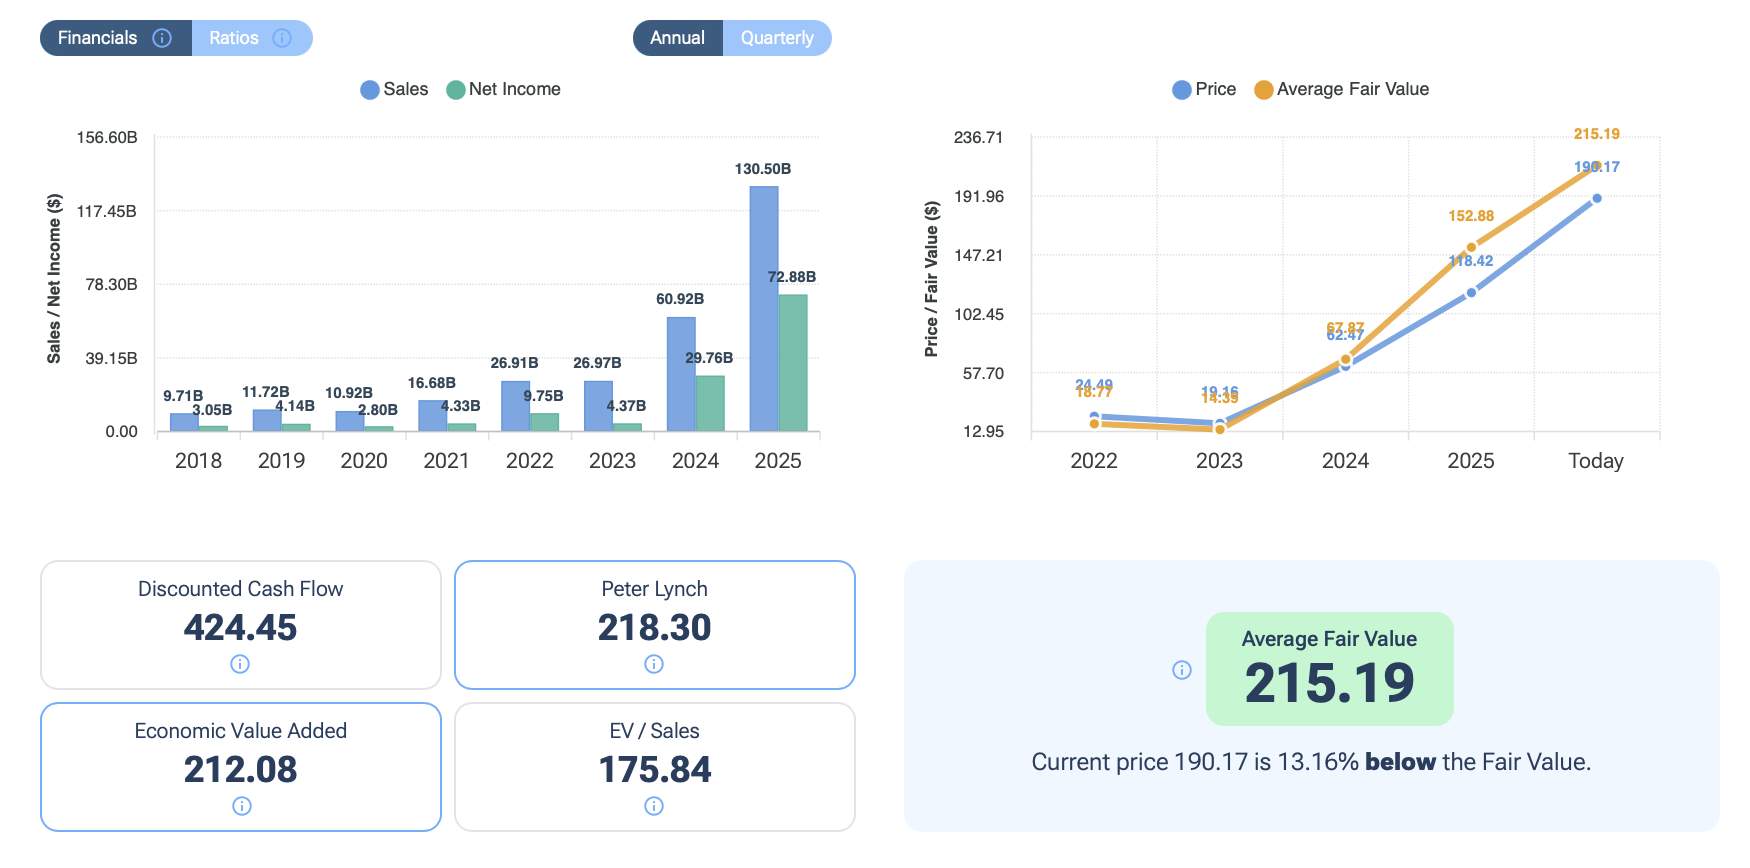
First, the fundamental analysis module was consulted. The valuation model was refined by disabling the “Enterprise Value to Sales” metric—a tool better suited for unprofitable growth companies, which Nvidia certainly is not.
After focusing on the most coherent models for a highly profitable entity (such as the Economic Value Added and Peter Lynch methods), the Forecaster indicated a fair value range between $212 and $218 per share. With the stock price already testing this range, the fundamental analysis suggested the remaining undervaluation was nominal (approx. 4%), implying the stock was now fairly priced after its massive run.
2. Technical and seasonal headwinds
While the fundamentals showed the stock was “full,” the technical and seasonal data suggested a high probability of a reversal.
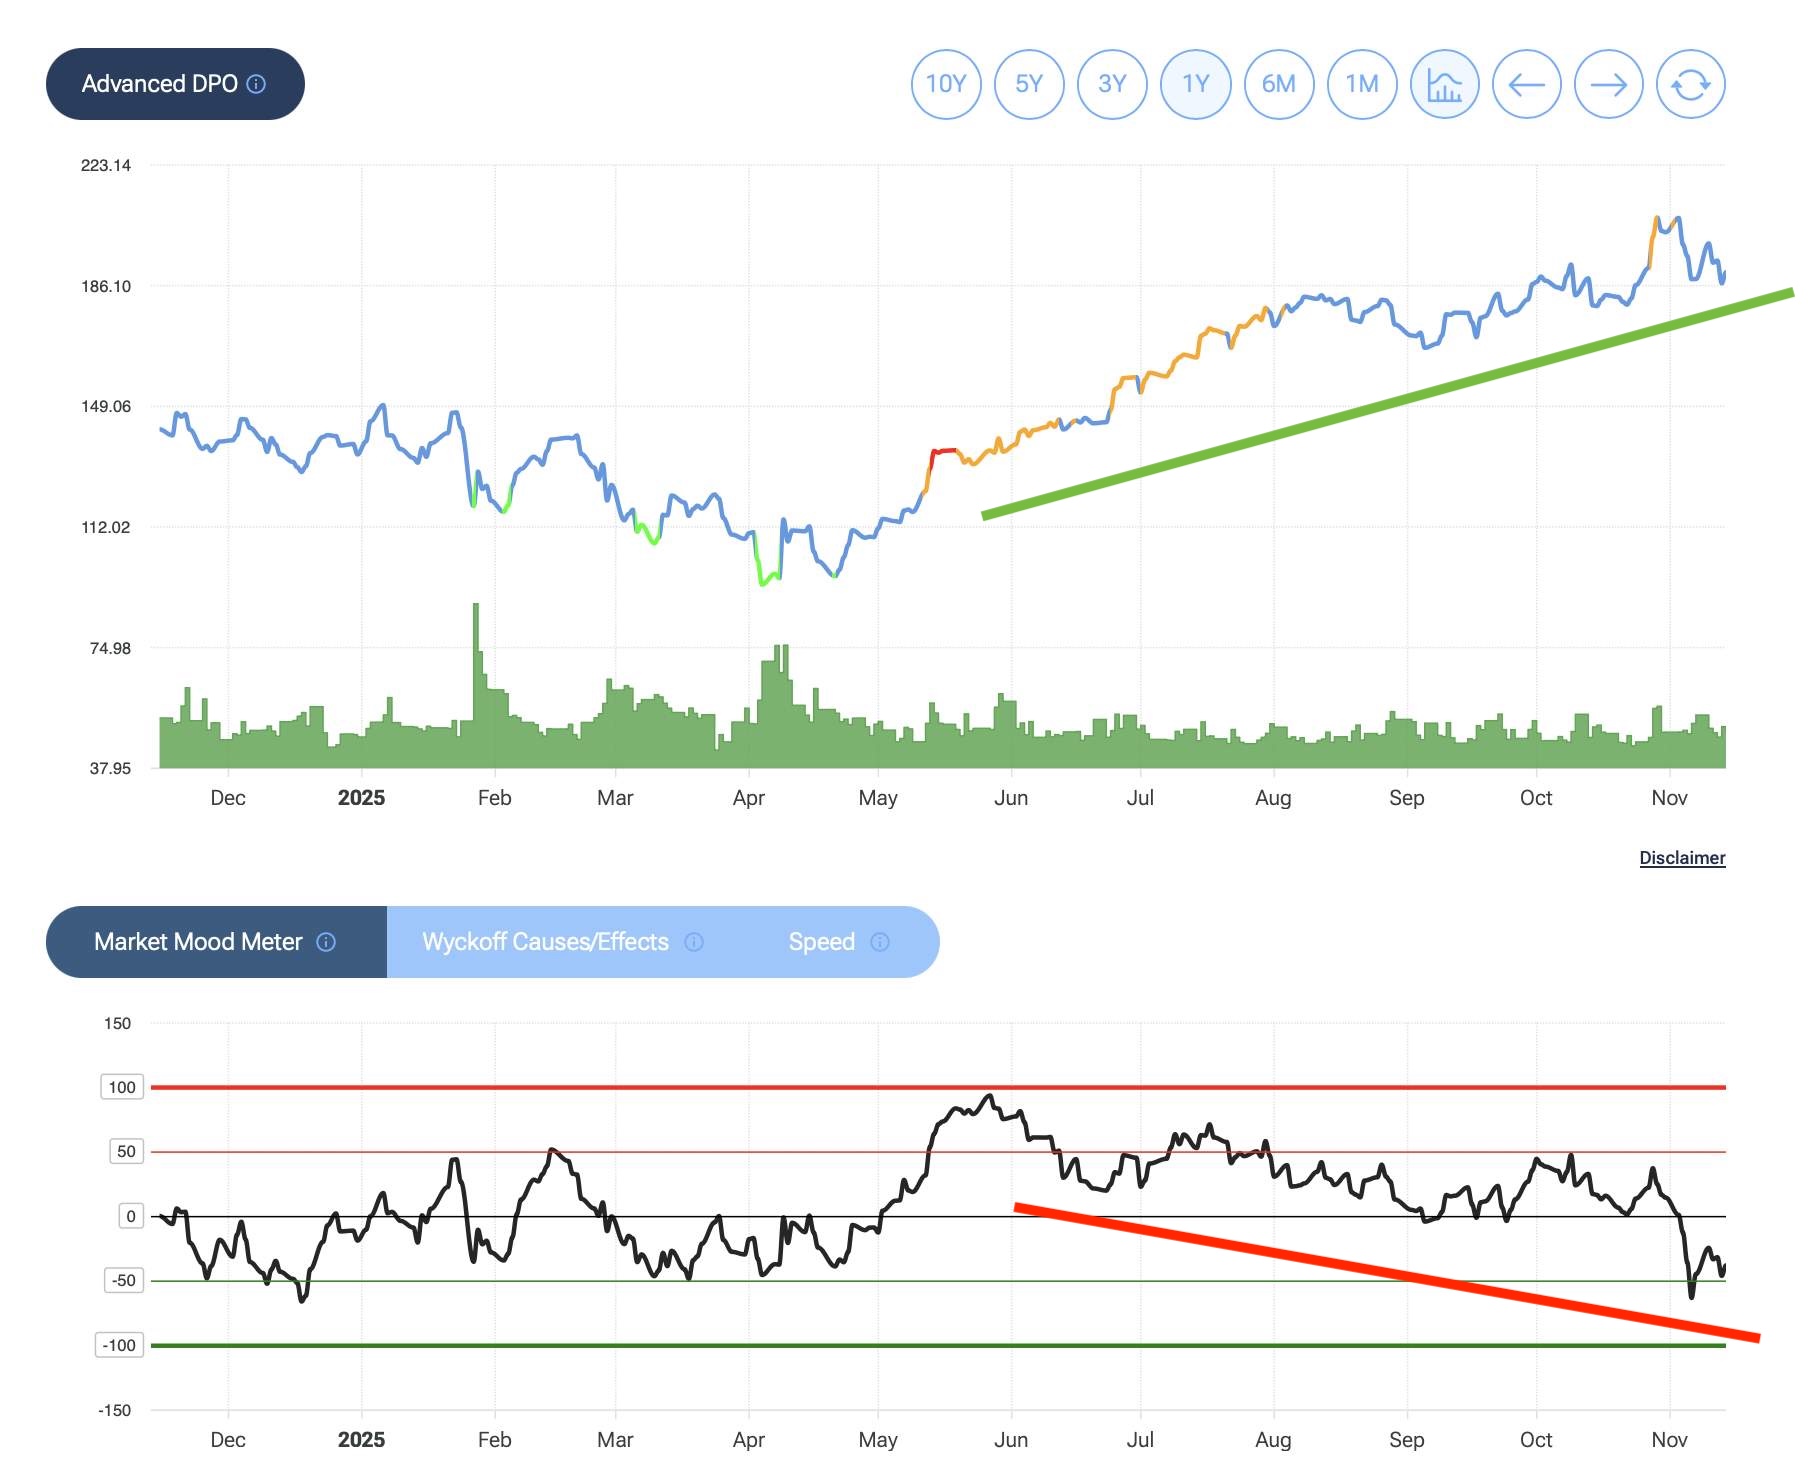
Bearish divergence: Perhaps the most compelling signal came from the “Overbought/Oversold” section. The Forecaster‘s proprietary Market Mood Meter (an indicator blending Wyckoff principles and price speed) was showing a classic bearish divergence: the stock price was making new highs, but the indicator was failing to follow, showing weakening underlying strength.
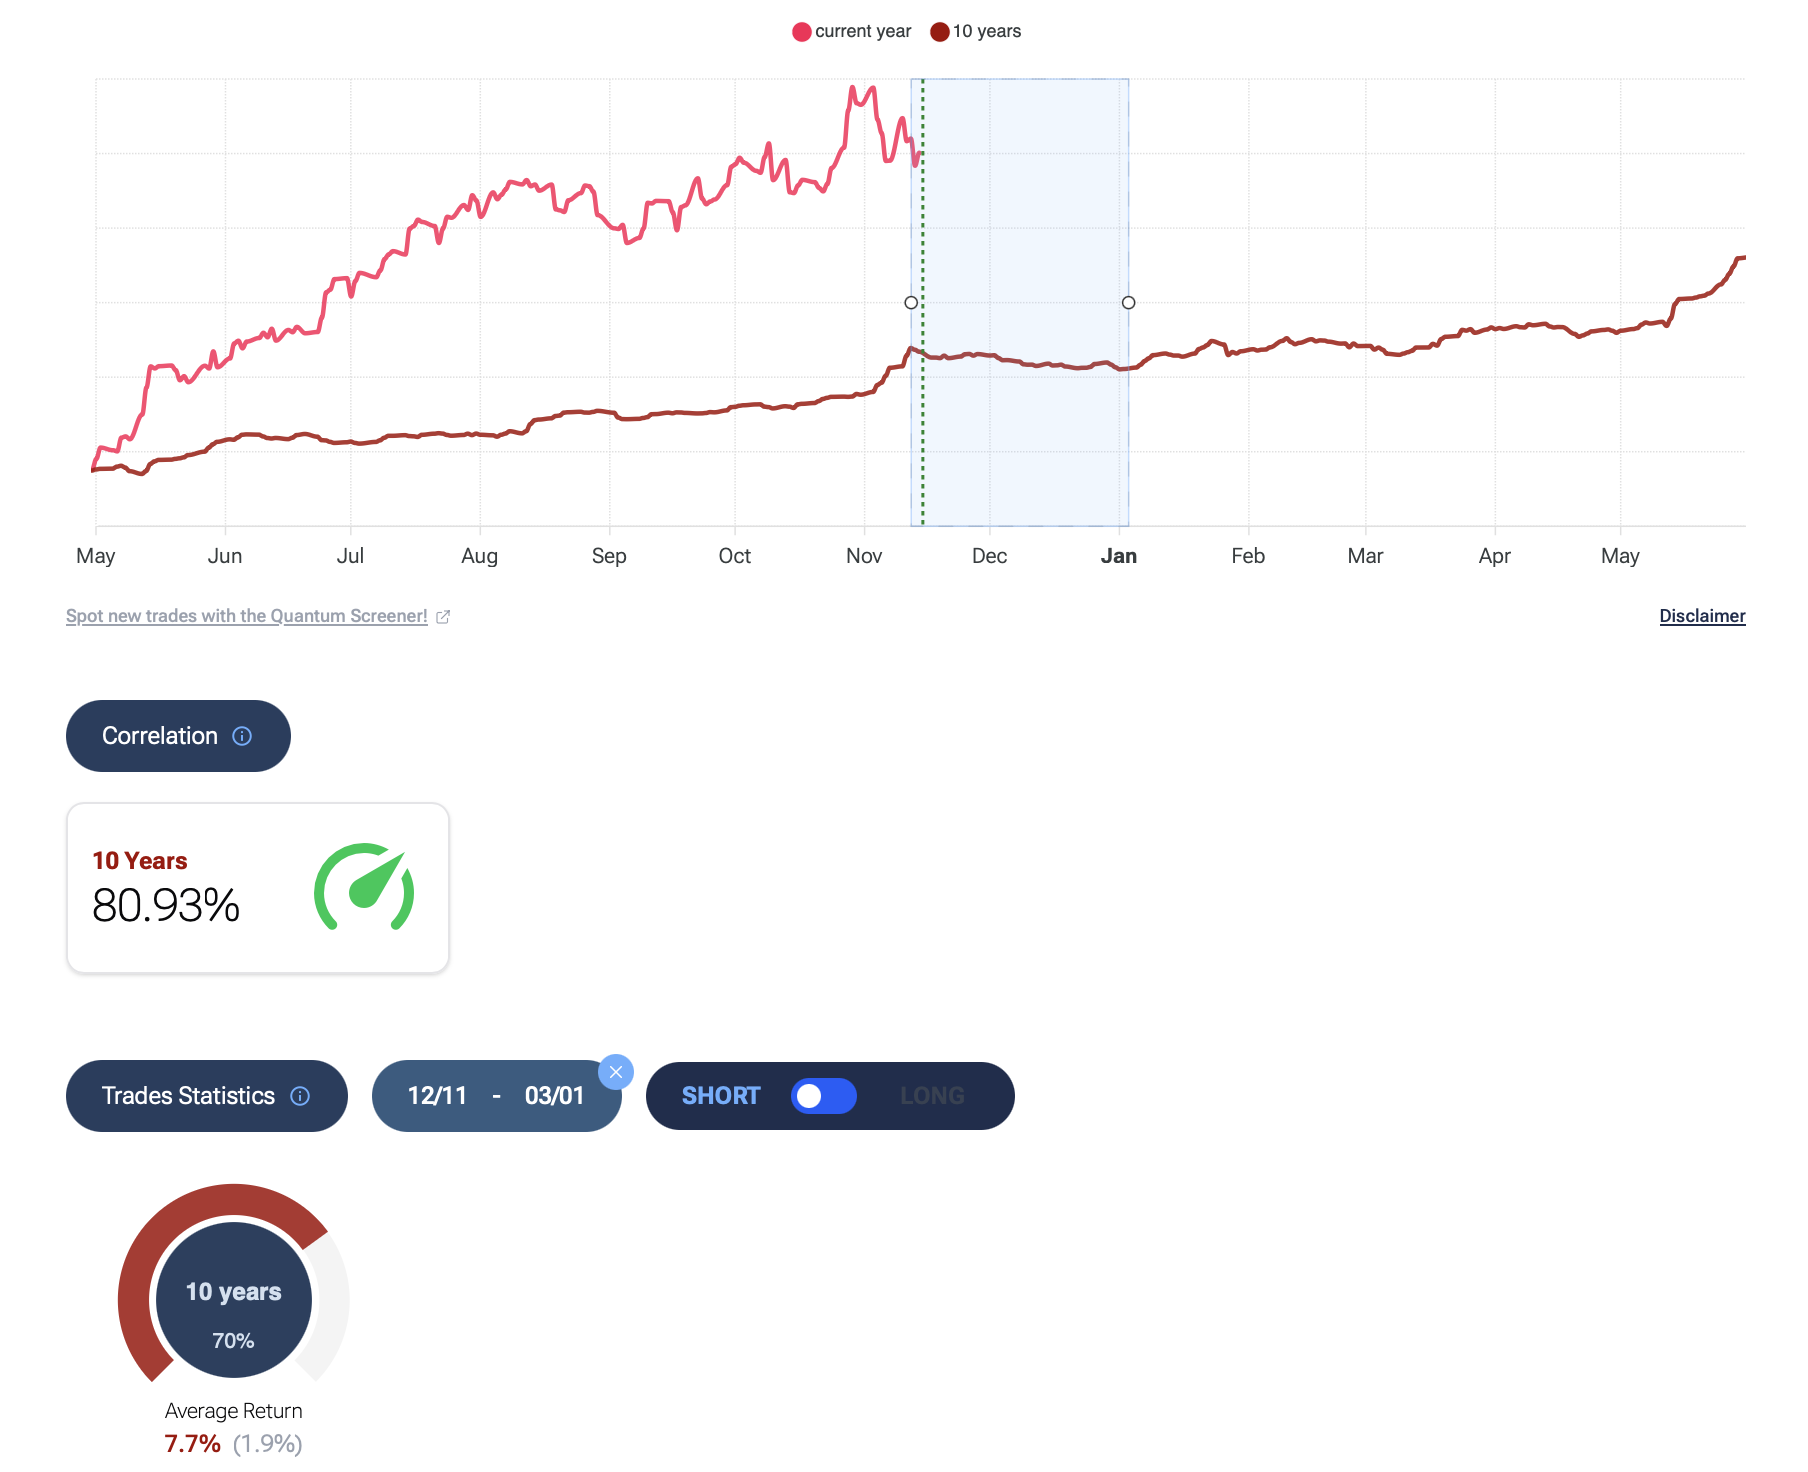
Negative seasonality: The seasonality module, which correlates current price action with historical patterns, identified the 10-year cycle as the most relevant. This pattern clearly indicates the start of a historically weak period for Nvidia beginning in mid-November. Statistically, this specific window has seen the stock decline 70% of the time over the past decade.
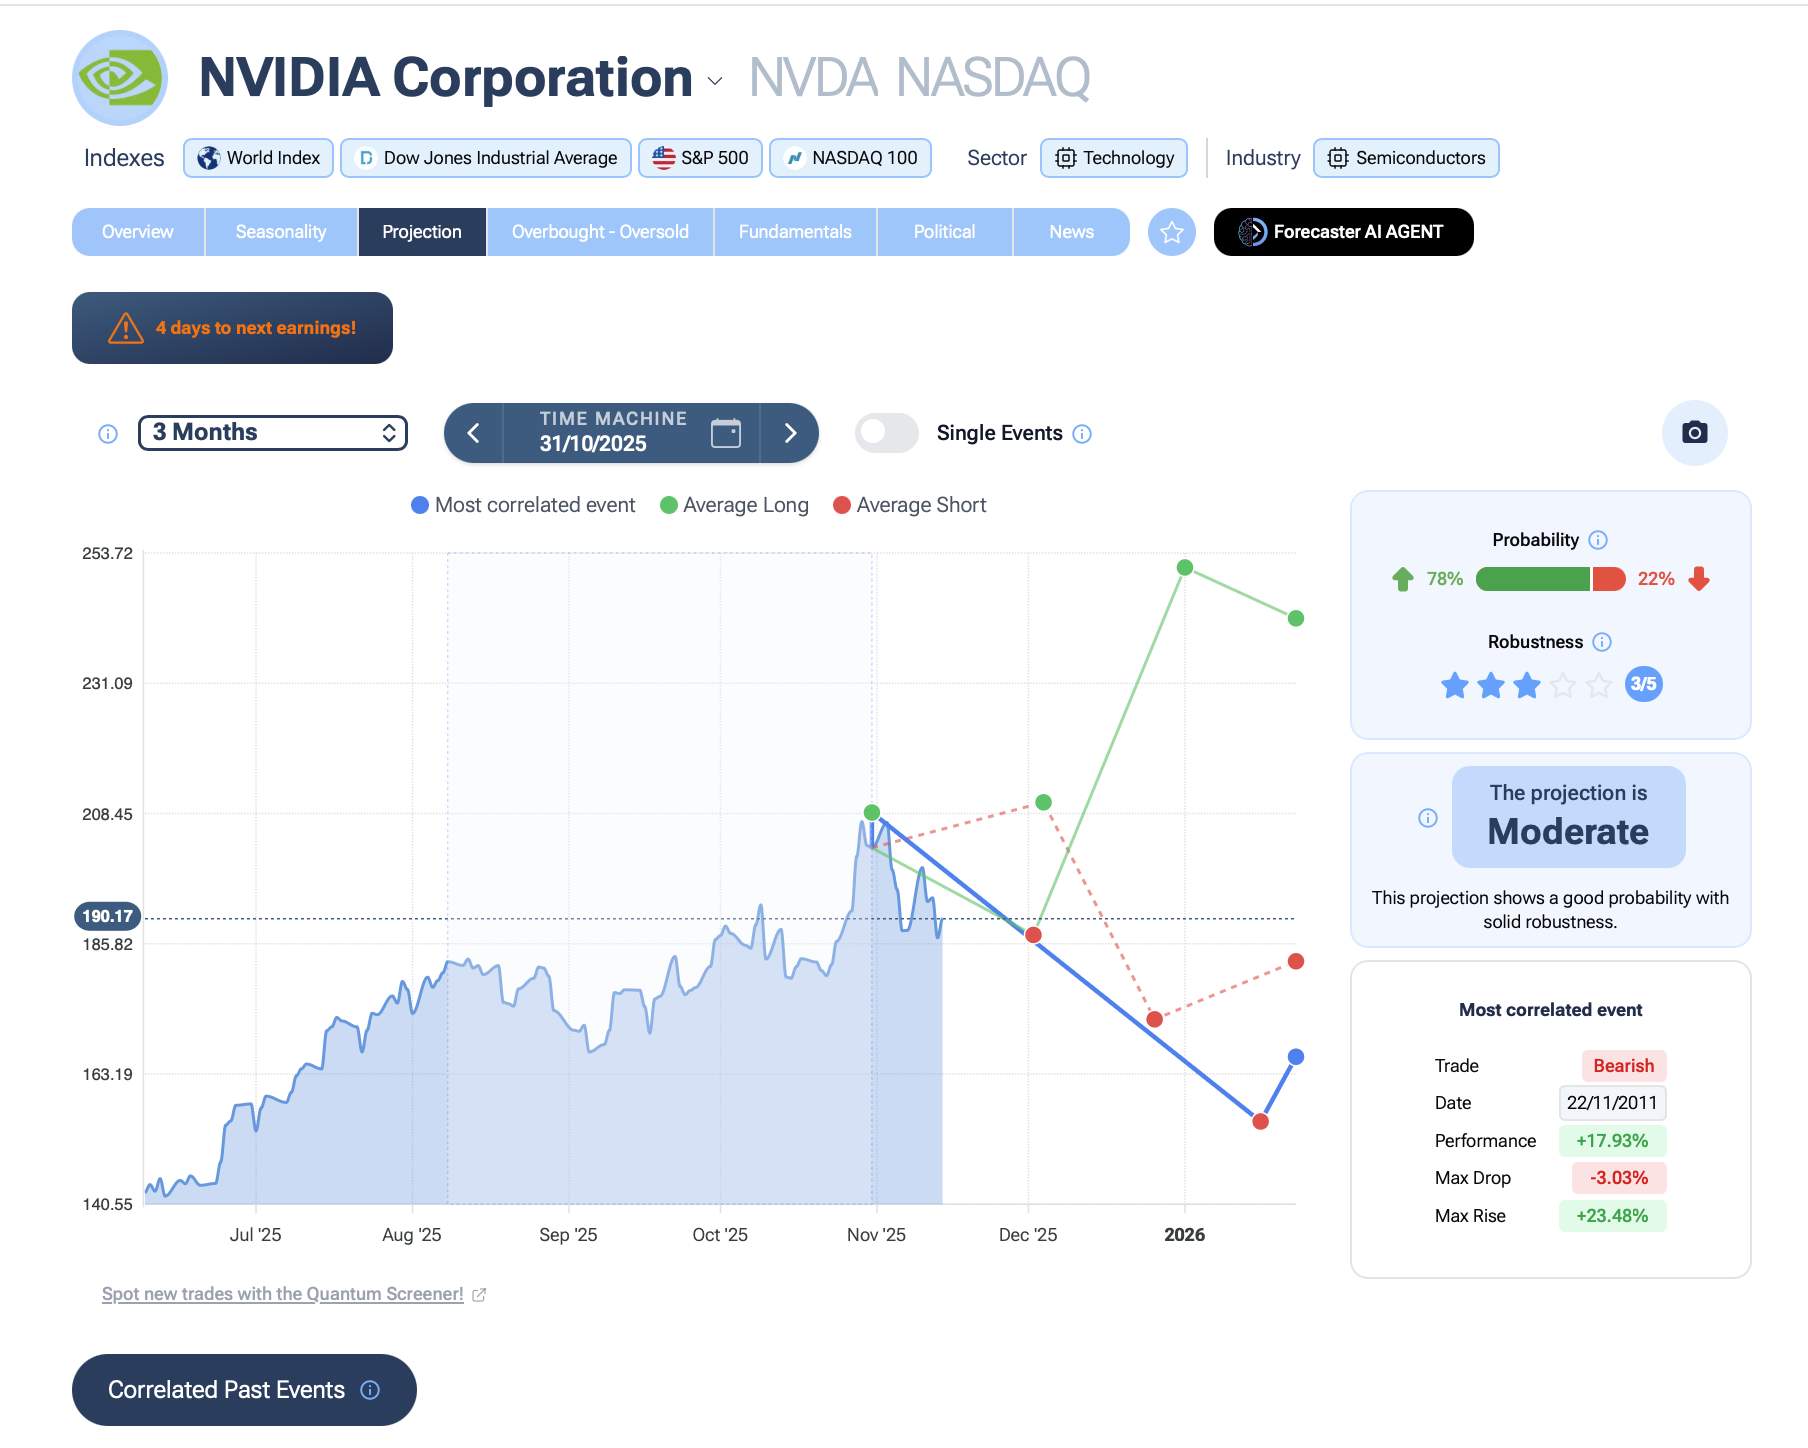
Capped projections: Finally, the “Projections” tool, which uses historical pattern matching, backed up this thesis. The strongest “Strong” projections, while still bullish, showed average targets near $214 and best-case targets around $231. This suggested that even in a bullish outcome, the immediate upside potential was severely limited.
Conclusion: disciplined profit-taking
The decision to sell the tactical position was a straightforward conclusion based on this evidence. The confluence of a full valuation, a clear bearish divergence, impending seasonal weakness, and capped price projections created a high-risk, low-reward setup for a short-term trade.
This move locks in substantial profits—profits generated with real capital—and converts them into liquidity. The long-term “Core” position remains firmly in place. However, this new liquidity provides the flexibility to re-enter a tactical position should the market provide a significant correction, such as a 10% pullback, creating a more favorable entry point.