
I SOLD (almost) ALL MY STOCKS: Here’s What the Data Says – [Updated August 29, 2025]
UPDATE – August 29, 2025
LINK TO NEW VIDEO
When I wrote this article on August 7, I highlighted how closely 2025 price action was following historical seasonality, with correlations above 90% across different timeframes. That picture has not changed, if anything, it has become even clearer. The scenario we described back then is still fully valid today.
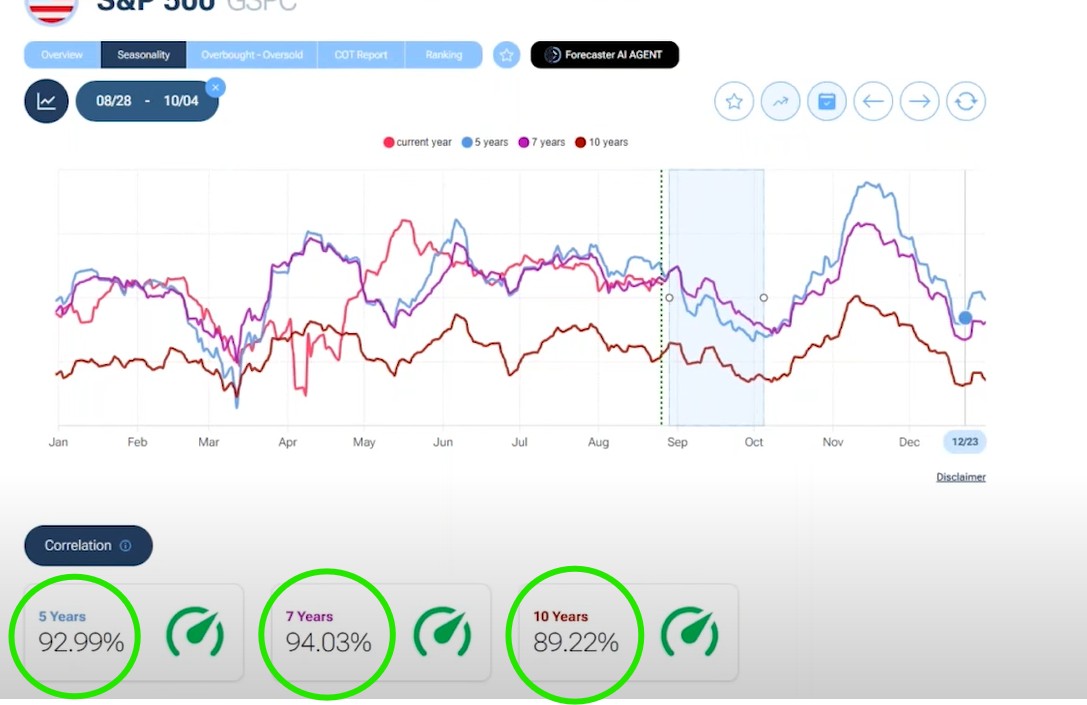
Looking at the S&P 500, the correlation with past seasonal patterns remains extraordinary: 94% with the 7-year average and 92% with the 5-year, while the 10-year is also very strong at 89%. Using Forecaster’s detrended seasonality makes it even more evident, prices are tracking almost perfectly the historical late-summer correction phase. Based on these models, we can expect a further pullback of around -4.5% into September, before markets typically bottom out and begin to rise again toward the very end of September or early October.
Despite being at all-time highs, the S&P 500 appears fairly valued at the index level, even slightly undervalued relative to Forecaster’s fair value calculation. This alignment between price and fundamentals explains why there is fear in the market: when valuations look fair, uncertainty tends to be higher. Yet, corporate results and forward guidance remain solid, and recession risks in the near term appear limited.
In short, nothing in the seasonal outlook has changed since early August. If history continues to rhyme, we are simply passing through the expected late-summer weakness before the traditional year-end rally. Under these conditions, the S&P 500 still has the potential to push toward 7,000 points before the end of the year.
 Key Takeaways
-
The S&P 500 has reached fair value, signaling a shift from an undervalued market to a more cautious phase where institutional buying may slow down and volatility may increase.
-
Hedge funds are currently net short, creating a setup similar to 2023. If the market continues to rise, a wave of short covering could trigger a powerful rally later in the year.
-
Corporate earnings are at record highs, with $2.30 trillion in net income across the S&P 500, supporting the view that any summer weakness could be followed by a strong year-end breakout.
As the summer unfolds, global financial markets are navigating through a highly delicate phase. Investors are closely monitoring a combination of macroeconomic signals, market positioning, and technical indicators to determine where equities might head next. To shed light on this complex landscape, let’s begin with what the Forecaster AI terminal is currently reporting on the macro environment.
“The US markets are being driven by expectations of a potential rate cut from the Federal Reserve, following a weaker-than-anticipated jobs report. This has fueled speculation that the central bank may soon intervene to stimulate the economy. Market participants are now awaiting the upcoming ISM Services PMI and trade balance data for further clues on the economy’s trajectory.”
In this uncertain context, market volatility is beginning to climb once again. The VIX index, commonly referred to as the market’s “fear gauge,” is on the rise, and despite some short-term rebounds, equity markets appear jittery. This is the backdrop against which we now evaluate potential market movements through the lens of data available on the Forecaster platform.
S&P 500 Reaches Fair Value: What This Signals
One of the most significant developments in recent weeks has been the sharp appreciation of the S&P 500, pushing it to a level where the index is now trading almost exactly in line with its fair value. According to Forecaster’s automated valuation models, which average discounted cash flow, Peter Lynch valuation, and economic value added, the index is now just 2.27% undervalued.
In practical terms, this means that the market has transitioned from a previously undervalued state to what can be considered a “fully priced” or fair valuation zone.
Historically, this is a crucial threshold. Every time the S&P 500 has approached or reached fair value in the past, institutional investors tend to become more cautious. Without the cushion of undervaluation, their appetite for new long positions diminishes. Worse, if any adverse macroeconomic developments arise, be it trade tensions, inflationary pressures, or geopolitical instability, these institutions may quickly pivot from holding to selling.
This shift from a bullish to a cautious stance often precedes short-term pullbacks or consolidation periods, which could very well be the scenario we’re entering now.

COT Report Reveals Divergences: Asset Managers Cautious, Hedge Funds Bearish
To gain deeper insight into institutional behavior, we turn to the Commitment of Traders (COT) Report, a weekly disclosure published by the CFTC that reveals how different classes of investors are positioned in the futures markets.
First, let’s consider asset managers, whose mandate is typically long-term and directional (i.e., mostly long-only). While the S&P 500 is trading at all-time highs, their net long positions are now at the same levels as they were in early 2025, the last time the index reached record highs. This implies that while prices have risen, asset manager enthusiasm has not kept pace, suggesting a divergence between price action and institutional conviction.
Compare this with the sentiment from summer 2024, when asset managers were aggressively increasing their net long positions, reaching record optimism. That rally was based on momentum supported by fundamentals. Now, the positioning is much more tepid.
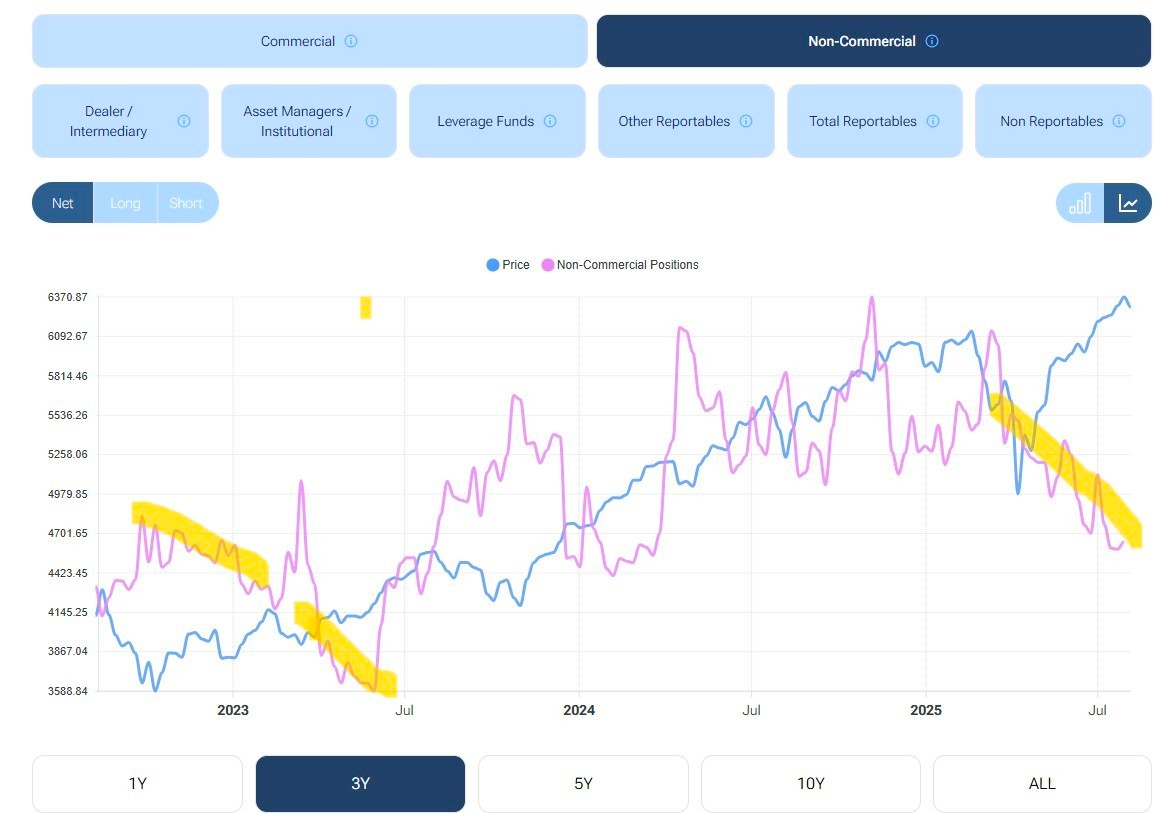
More surprisingly, however, is the behavior of non-commercial traders, primarily hedge funds. These speculative actors are currently net short on the S&P 500, a stark contrast to their position during much of 2023 and 2024. They began building these short positions earlier this year, correctly anticipating a short-term dip. But as the market continued climbing, their bearish bets began to underperform.
This setup is eerily reminiscent of the 2022–2023 period, when hedge funds also went aggressively short, only to be forced into a massive short squeeze when the market defied expectations and rallied. That capitulation triggered a wave of short covering, pushing the market to new highs by early 2025.
Should history repeat itself, a similar dynamic could play out in the coming months: hedge funds may once again find themselves on the wrong side of the trade, triggering a wave of buying as they rush to cover their positions.
Seasonality Supports a Temporary Pullback Followed by Strong Year-End Rally
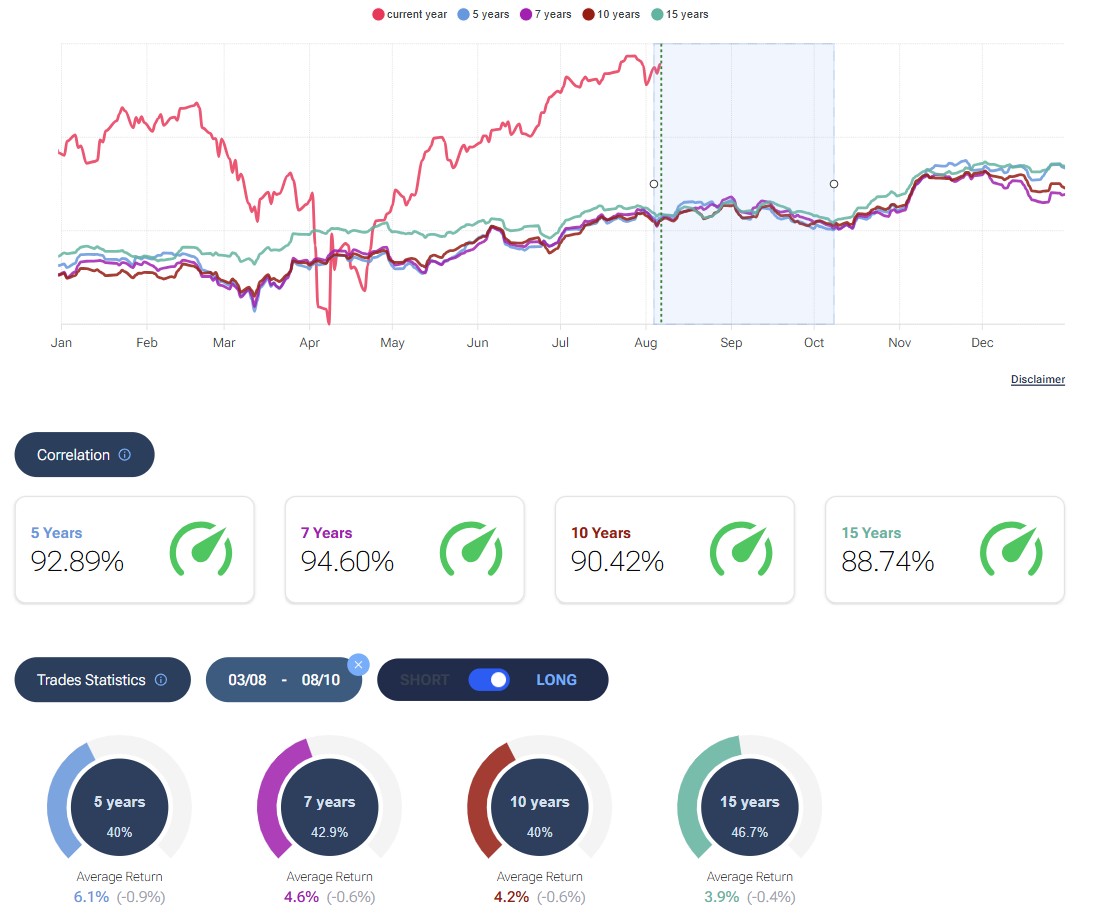
Using Forecaster’s seasonality models, we can evaluate how the current year is behaving in relation to historical trends. Interestingly, the correlation between 2025 price action and past seasonal patterns is exceptionally high, 93% with the 5-year average, 94% with the 7-year, and around 90% with the 10- and 15-year averages.
According to this data, the period between early August and early October tends to be one of the most ambiguous stretches of the year, markets exhibit a roughly 50/50 chance of rising or falling. In other words, we are likely entering a sideways market phase, potentially with mild downward bias.
When using the detrended version of the seasonal chart, which filters out long-term growth to highlight cyclical patterns—it becomes even clearer: current price behavior is mirroring historical corrections that typically occur in late summer.
However, the key takeaway here is not the potential pullback, but what follows. Historically, October marks the beginning of a powerful bullish phase, often lasting through year-end and into Q1. If this pattern holds, and if hedge funds begin covering shorts in response to rising prices, we could see a sharp rally toward new all-time highs, potentially pushing the S&P 500 toward 7,000 points, up from the current level around 6,300.
Fundamentals Still Strong: Net Income Driving Price Growth
Amidst all the technical and positioning analysis, it’s vital not to lose sight of the underlying fundamentals. Forecaster aggregates financial data for every component of the S&P 500 and plots metrics such as net income and sales growth against the index level. What the data shows is powerful: net income has reached a record high of $2.30 trillion, compared to $1.81 trillion in 2024.
This surge in corporate profitability underpins the market’s resilience. In the long term, stock prices track earnings, and this historic jump in net income justifies the market’s climb.
Case in point: companies like Nvidia clearly illustrate this principle. Over time, their stock price trajectories have followed the curve of net income growth. This same logic applies to the index as a whole.
Therefore, even if a pullback materializes during late summer, the strength of the underlying earnings suggests that any correction will likely be a buying opportunity, rather than the start of a deeper bearish phase.
Conclusion: Summer Pause, Autumn Breakout?
To summarize, the market is now entering a critical period of consolidation:
-
The S&P 500 is fairly valued, leaving little room for speculative upside in the short term.
-
Institutional investors are cautious, while hedge funds are outright bearish, setting the stage for a potential reversal.
-
Seasonality indicates a neutral-to-negative stretch through August and September, but with a strong historical pattern of year-end rallies.
-
Corporate fundamentals remain robust, with record-high net income serving as a solid foundation.
Given these factors, it seems plausible that the next two months will see choppy or slightly negative price action, followed by a sharp breakout rally beginning in October. If hedge funds begin closing their shorts at that point, as they did in 2023, the market could skyrocket to new highs, potentially exceeding 7,000 on the S&P 500 by early 2026.
In light of this, reducing exposure now to protect gains, as some investors are doing, may be prudent. But staying informed and ready to re-enter in early Q4 could be the best strategy for capturing the next major upward leg.


